Prometheus是一个灵活的时间序列数据库和监控系统,有多个监控组件可用。Grafana是用于展示数据的平台。一起使用即可全方位监控VPS主机运行状态。
prometheus和grafana为简化安装步骤,这里直接使用docker.
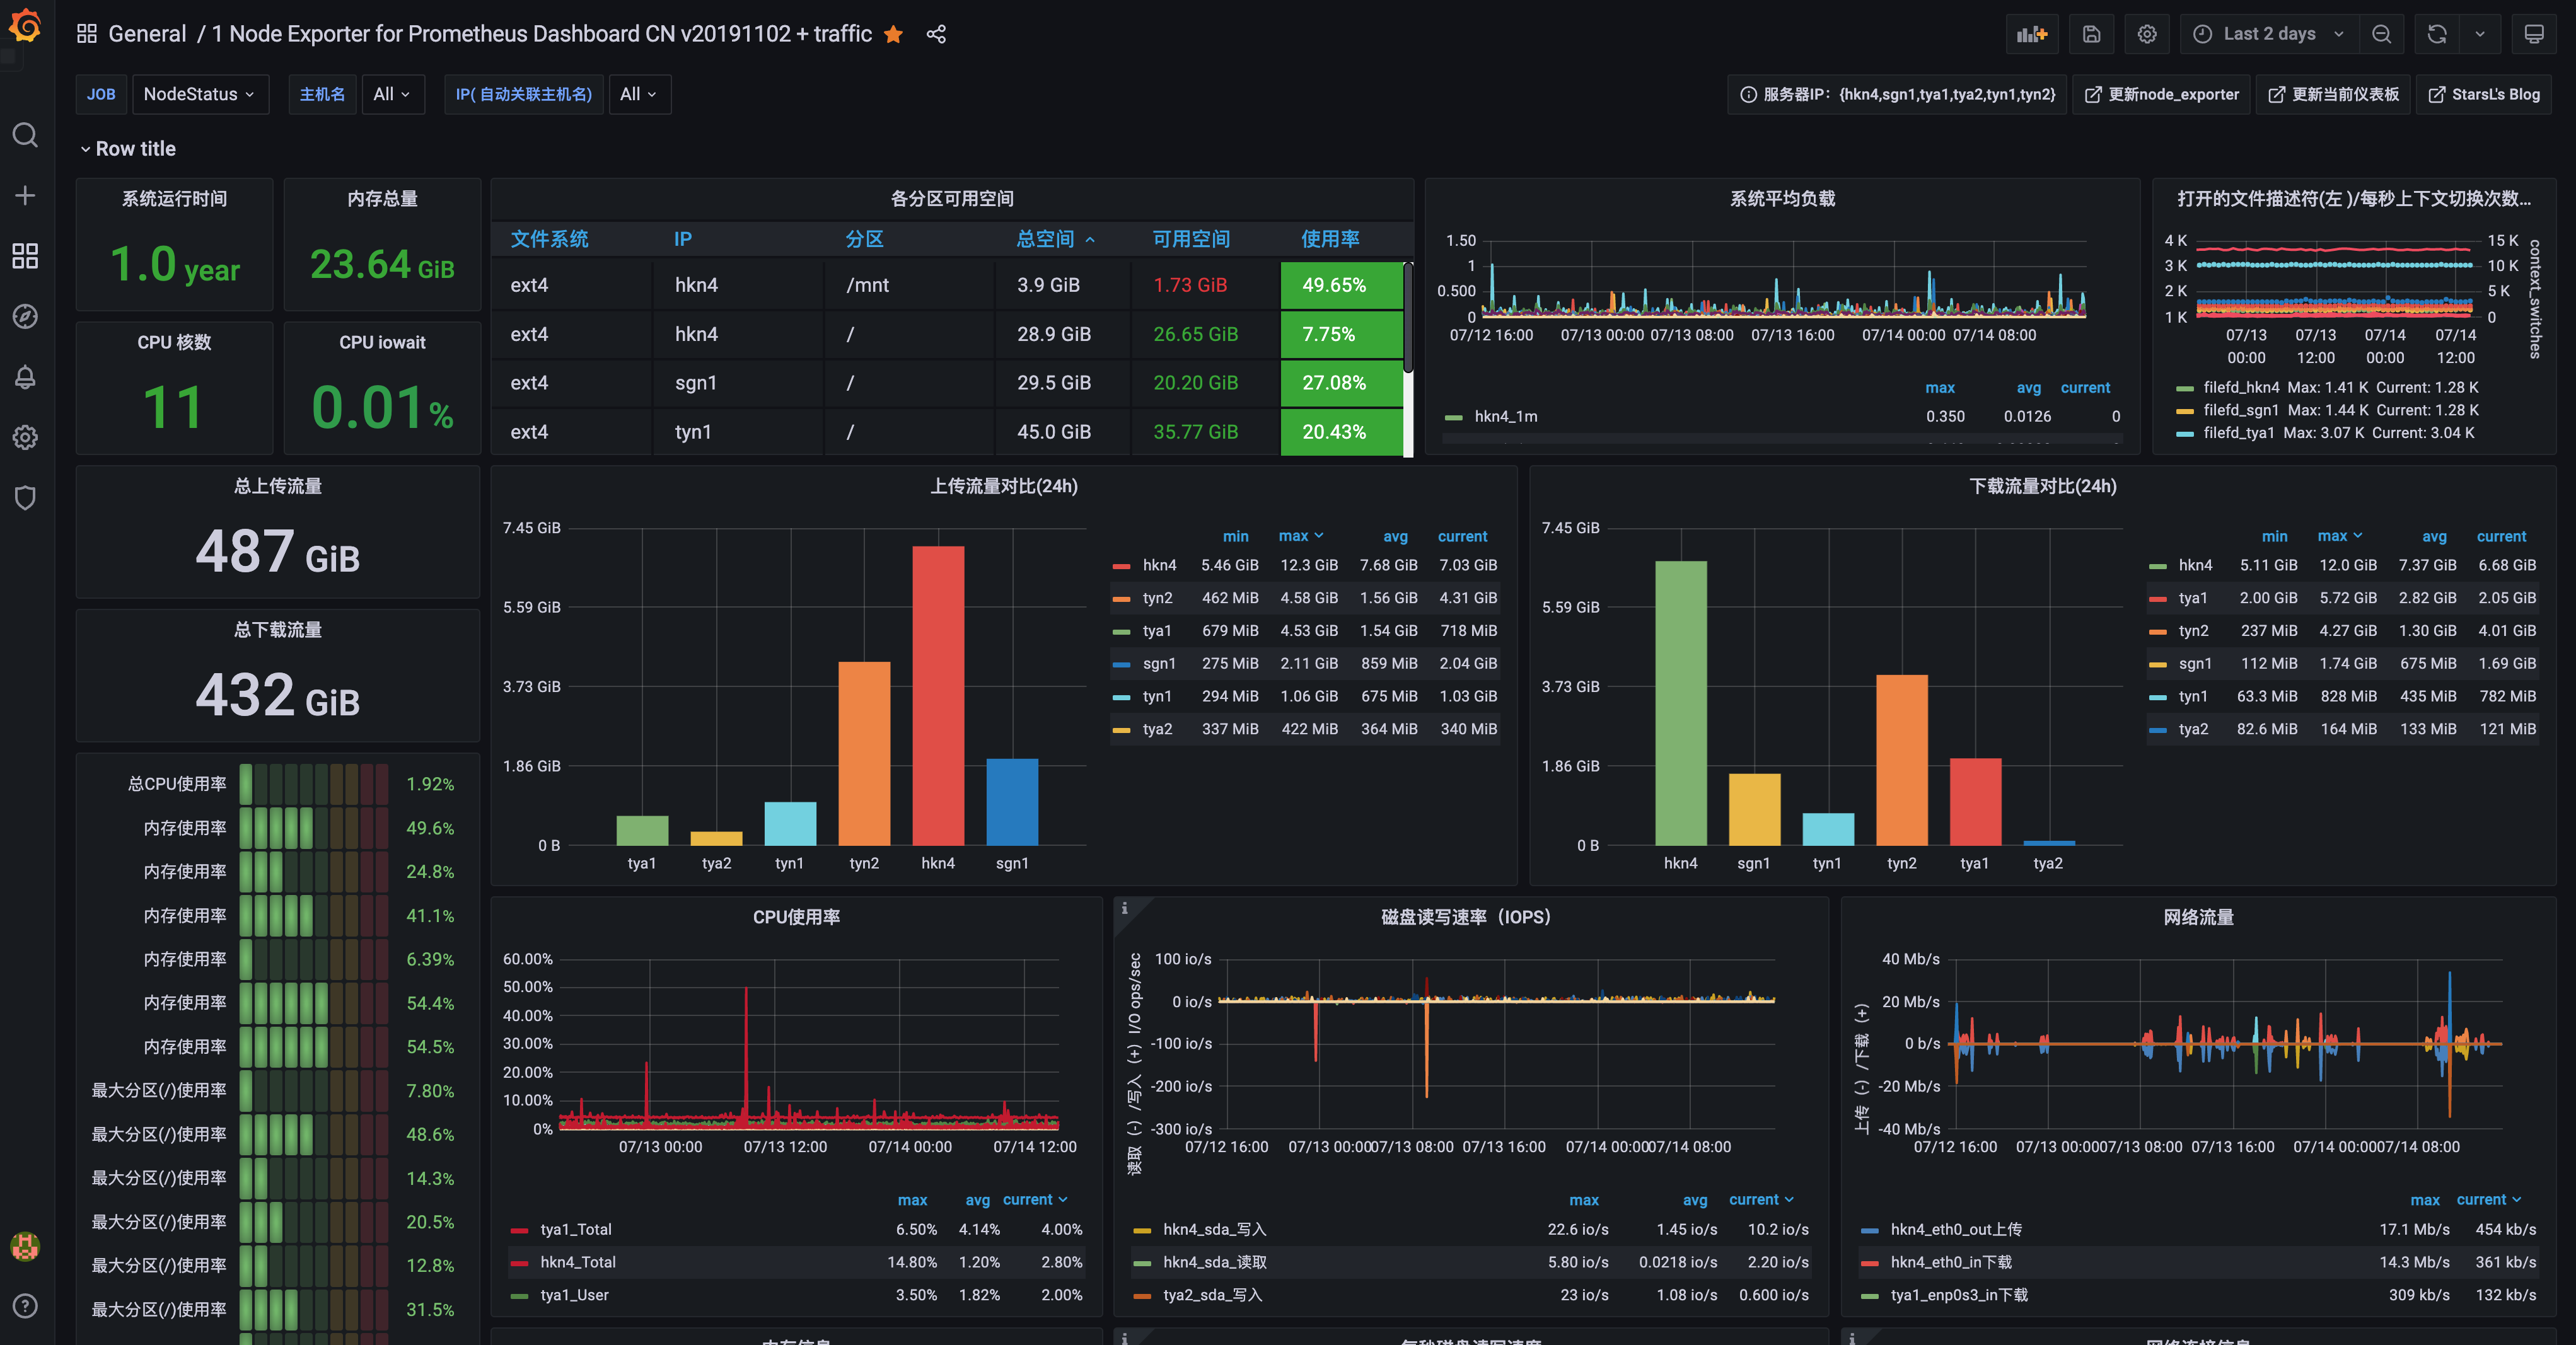
效果图
安装
- 首先你要安装docker/docker-compose:
1
2
3
4
5
6
7
| apt -y update
apt -y install curl
curl -sSL https://get.docker.com/ | sh
systemctl start docker
systemctl enable docker
curl -L https://github.com/docker/compose/releases/download/1.25.4/docker-compose-`uname -s`-`uname -m` -o /usr/local/bin/docker-compose
chmod +x /usr/local/bin/docker-compose
|
- grafana.ini 从 https://raw.githubusercontent.com/grafana/grafana/main/conf/sample.ini 下载
- 然后使用项目目录下的
docker-compose.yml
1
2
3
4
5
6
7
8
9
10
11
12
13
14
15
16
17
18
19
20
21
22
23
24
25
26
27
28
29
30
31
| version: '3.5'
services:
prometheus:
image: prom/prometheus
container_name: prometheus
ports:
- 9090:9090
user: '0'
volumes:
- ./prometheus-data:/prometheus
- ./prometheus.yml:/etc/prometheus/prometheus.yml
- ./web.yml:/etc/prometheus/web.yml
command:
- '--config.file=/etc/prometheus/prometheus.yml'
- '--web.config.file=/etc/prometheus/web.yml'
- '--web.enable-admin-api'
- '--web.enable-lifecycle'
grafana:
image: grafana/grafana
container_name: grafana
ports:
- 9000:3000
user: '0'
volumes:
- ./grafana.ini:/etc/grafana/grafana.ini
- ./grafana-data:/var/lib/grafana
|
- 新建或修改
hosts.txt, 添加机器名
1
2
3
4
5
6
7
| tya1.baidu.tech
tya2.baidu.tech
tyn1.baidu.tech
tyn2.baidu.tech
hkn1.baidu.tech
sgn1.baidu.tech
krn3.baidu.tech
|
- 修改 node_exporter.sh 并在每一个节点上执行
看自己情况是否需要添加防火墙例外和修改默认 basic auth 密码, 默认为: 2003GB
https://prometheus.io/docs/guides/basic-auth/
1
2
3
4
5
6
7
8
9
10
11
12
13
14
15
16
17
18
19
20
21
22
23
24
25
26
27
28
29
30
31
32
33
34
35
36
37
38
39
40
41
42
43
44
45
46
47
48
49
50
51
52
53
| #!/bin/env bash
sudo firewall-cmd --zone=public --permanent --add-port=9100/tcp
sudo firewall-cmd --reload
tar_path="/tmp/1.tar.gz"
node_exporter_url="https://github.com/prometheus/node_exporter/releases/download/v1.3.1/node_exporter-1.3.1.linux-amd64.tar.gz"
wget -O $tar_path -q $node_exporter_url
untar_dir="/opt"
stand_node_exp_dir="${untar_dir}/node_exporter"
stand_node_exp_conf="${stand_node_exp_dir}/config.yml"
stand_prom_pass="\$2y\$10\$/cO6/ZV2L89x4a/D/KSV8ONXY36hD0.wFGi8XXqCO.gFY3jSIxf7S"
if [ ! -d $untar_dir ]; then
mkdir $untar_dir
fi
cd $untar_dir
tar -xvf $tar_path
node_exporter_verion_dir=$(ls | grep node_ex | head -n 1)
if [ ! -e $stand_node_exp_dir ]; then
ln -s $node_exporter_verion_dir $stand_node_exp_dir
fi
echo -e \
"basic_auth_users:
node: $stand_prom_pass
" >$stand_node_exp_conf
echo -e \
"[Unit]
Description=Node Exporter
Wants=network-online.target
After=network-online.target
StartLimitIntervalSec=500
StartLimitBurst=5
[Service]
User=root
Group=root
Type=simple
Restart=on-failure
RestartSec=5s
ExecStart=${stand_node_exp_dir}/node_exporter --web.config=$stand_node_exp_conf
[Install]
WantedBy=multi-user.target
" >/etc/systemd/system/node_exporter.service
systemctl daemon-reload
systemctl enable node_exporter
systemctl restart node_exporter
|
- 修改 prom.sh 并在promethus节点上执行
看自己情况是否需要添加防火墙例外和修改默认 basic auth 密码, 默认为: 2003GB
https://prometheus.io/docs/guides/basic-auth/
1
2
3
4
5
6
7
8
9
10
11
12
13
14
15
16
17
18
19
20
21
22
23
24
25
26
27
28
29
30
31
32
33
34
35
36
37
38
39
40
41
42
43
44
45
46
47
48
49
50
51
52
53
54
| #!/bin/env bash
sudo firewall-cmd --zone=public --permanent --add-port=9090/tcp
sudo firewall-cmd --zone=public --permanent --add-port=9000/tcp
sudo firewall-cmd --reload
prom_job_name="NodeStatus"
prom_stand_yml="./prometheus.yml"
prom_stand_web_yml="./web.yml"
stand_prom_pass="\$2y\$10\$/cO6/ZV2L89x4a/D/KSV8ONXY36hD0.wFGi8XXqCO.gFY3jSIxf7S"
hosts="hosts.txt"
prometheus_host=$(head -n 1 $hosts)
echo "
basic_auth_users:
node: $stand_prom_pass" >$prom_stand_web_yml
echo -e \
"
global:
scrape_interval: 5s
external_labels:
monitor: 'imlala'
scrape_configs:
- job_name: 'prometheus'
static_configs:
- targets:
- '$prometheus_host:9090'
labels:
instance: prometheus
basic_auth:
username: 'node'
password: '2003GB'
- job_name: '$prom_job_name'
basic_auth:
username: 'node'
password: '2003GB'
static_configs:" >$prom_stand_yml
for i in $(cat $hosts); do
label=$(echo $i | awk -F. '{print $1}')
echo "label: $label -> target: $i"
echo -e \
" - targets:
- '$i:9100'
labels:
instance: $label
" >>$prom_stand_yml
done
echo -e "
"
|
- 确认无误后up起来即可:
docker-compose up -d - 如果后续你更改了prometheus.yml配置文件内容,可以直接执行下面的命令让prometheus热加载配置,不用重启prometheus容器:
1
2
| curl --location --request POST 'localhost:9090/-/reload' \
--header 'Authorization: Basic bm9kZToyMDAzR0I='
|
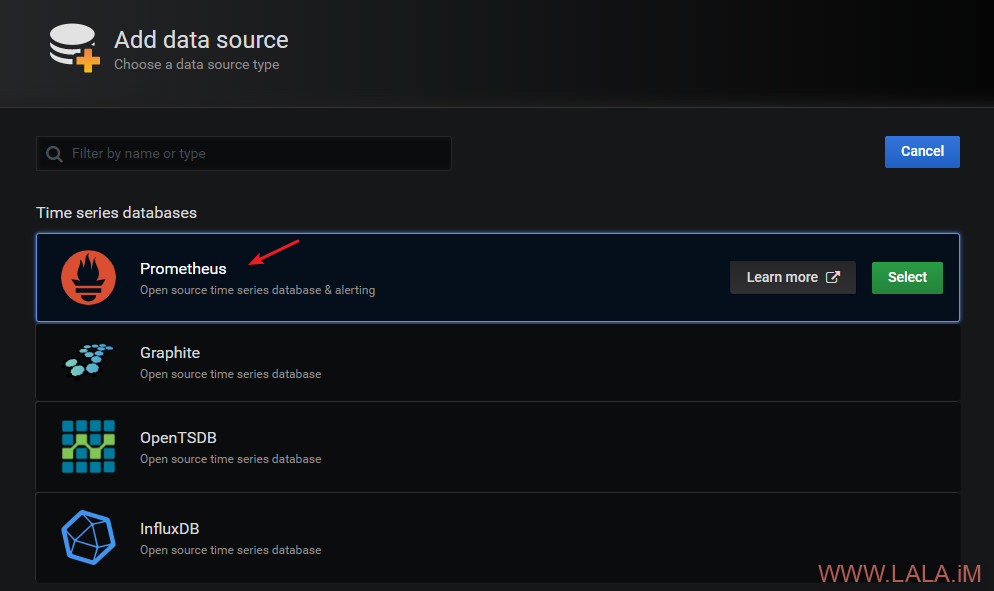
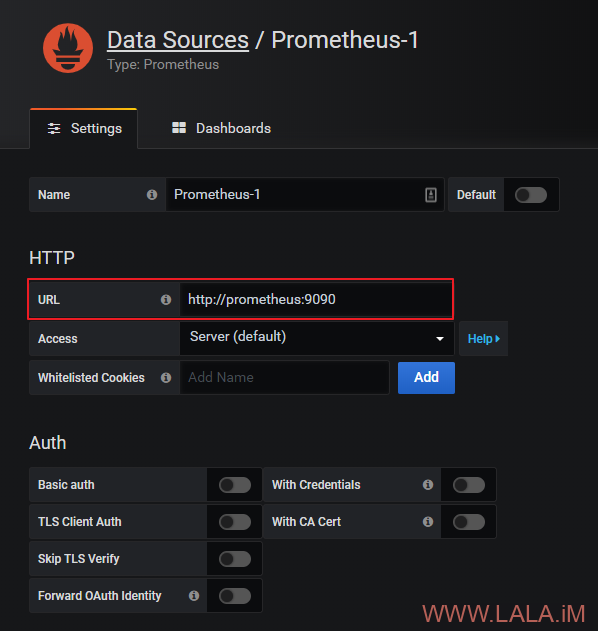
配置
Refer
- Docker+Prometheus+Grafana监控VPS运行状态
-------------本文结束再接再厉-------------

微信支付

支付宝